In this effortless Microsoft Excel tutorial, I’ll show you how to group rows in Excel using various methods for different datasets.
You might want to group rows in datasets of any size and structure for better organization, efficient data analytics, easier data summarization, better reporting, and improved readability.
However, if you plan to select multiple contagious or non-contagious rows manually and group them in a different or same worksheet, that’s not an efficient way. Moreover, it won’t serve the purpose of the Excel group rows functionality.
Read this article until the end and follow along with the methods. Here, I’ve presented semiautomatic and fully automated ways to group rows in the least possible steps and time.
📒 Read More: How to Group Similar Items in Microsoft Excel [Fuzzy Grouping]
Using the Auto Outline Command
The Auto Outline command in Excel automatically creates an outline for your data provided that it’s in the right format. You can use it successfully if your data is well-organized in a structured format. Typically, it should be hierarchical data where summary rows are distinct from the detailed data.

For example, you can apply the command in the above dataset. It contains a summary row after a few rows of numerical data. The summary rows also contain the SUM function to calculate the totals of the previous rows.

Organize your worksheet data in the above format and select the whole dataset.
Now, go to the Data tab and click on the Group drop-down command of the Outline commands block.
Click on the Auto Outline option in the context menu.

Excel shall automatically group the summary and detailed data rows in the selected worksheet as shown in the above screenshot.
If you click 1 in the outline navigation panel, you’ll only see the summary rows.

Contrarily, if you click 2 in the same panel, you’ll see all the data rows including the summary rows.
The drawback of this technique is your input dataset must be highly organized in a hierarchical structure. You can’t apply this method to any dataset.

If you attempt to use it on an unorganized dataset, you’ll get an error as shown above.
Using the Group Tool
Do you need to quickly group rows in Excel without restructuring the dataset? In this scenario, you can use the Group tool.
Using this Excel command, you can select any number of rows in the dataset to group them in one bundle. Then, you can select more rows inside the first group to create another group of rows. Ultimately, you can create a step-wise row hierarchy to show only a set of rows you want to see at a time.

Let me show you below how you can group the rows of the above dataset in the following groups:
- Rows visible for January
- Rows visible for January and February
- All rows are visible

First, select the whole dataset below the column header row and click on the Group command in Data > Outline commands block.

On the Group dialog, select Rows and click OK.

It’ll create an outline for the entire dataset.

Now select the rows for February and March and apply the Group command again for these rows. A 3rd outline will show up in the dataset.

Here, if you click the 2nd outline, only the January rows will be visible.

Finally, select the March rows and apply the Group command again. This will create the 4th outline.

Here, if you click on the 3rd outline, you’ll see rows from January and February.

The 4th outline makes March rows visible along with the 2nd and 3rd outlines, which makes all the datasets visible.
Excel Group Rows Hotkey
If you need to pace up the process of Excel group rows, you can select the target rows and press Alt + Shift + Right Arrow keys on the keyboard.
When you must delete a row group in Excel, you can press the Alt + Shift + Left Arrow shortcut.
Using the Subtotal Command

Let’s say, you’ve got a list of purchases for your organization as shown in the above screenshot.
You want to group all the rows of purchased items based on the departments, show subtotals of department-wise purchases, and finally show a grand total of all purchases.
In this scenario, you can use the Subtotal tool of the Outline commands block to group rows in Excel.

Select the entire input dataset along with the column headers. The Subtotal tool will use the column headers to create Excel group rows as well as show calculation options.
Click on the Subtotal command from the Data tab.

You should see the Subtotal dialog box. Here, do the following as outlined below:
- At each change in: This is the column header by which you want to create a subtotal row. In this example, it’s the Dept column.
- Use function: Use this drop-down menu to choose the calculation you want in the subtotal row. I’ll use the SUM function.
- Add subtotal to: Checkmark the column header to which you want to apply the subtotal calculation. Basically, Excel will perform an SUM for the values in the selected column at each subtotal interval. I’ve selected the Cost column in this exercise.
- Checkmark the Summary below data checkbox.
- Keep the rest of the items in their default settings state.
Click OK on the Subtotal dialog box to apply the configuration.
Excel will now transform the input dataset to show two outlines.

The 1st outline collapses or expands all the rows of the dataset. If collapsed, it’ll only show the Grand Total row.

The 2nd outline collapses the data rows and shows only the subtotal rows.

The plus icons in the 2nd outline allow you to collapse or expand the items of each subtotal summary row.
Using the Consolidate Tool

Let’s consider, that you’ve got three worksheets of expenses in the Facilities, IT, and Operations for three business sites.
You want a consolidated view of all these expenses with outlines for grouped rows in a different worksheet. In this scenario, you can use the Consolidate tool in the Data Tools commands block of the Data tab.
Using the Consolidate tool is fairly simple if you follow the exact instructions outlined below:

Go to the destination worksheet and click on A1. Now, go to Data > Data Tools commands block > click Consolidate.

The Consolidate dialog will pop up.
Choose a function by clicking the Function drop-down menu. I’ve chosen the SUM function in this exercise.

Click on the Reference field and go to the first dataset of expense data in another worksheet. Select the whole dataset and click on the Add button.
Now, repeat the same steps for the rest of the site expenses data.

The Consolidate dialog will look as shown in the above screenshot.

Checkmark the checkboxes for the Top row and Left column. Also, checkmark the Create links… checkbox.

Hit OK to create the Excel group rows.

Click on the outline expansion icon or plus icon to see the underlying grouped rows.
Using the Name Manager Tool
Suppose, your dataset is small to medium and views well within the borders of the current worksheet display. Here, if you want to focus on a specific group of rows without hiding the others, you can use the Name Manager tool.

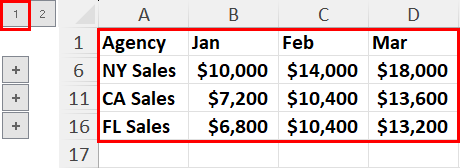
Let’s consider the dataset you’re working on is similar to the above example. You’d like to group the sales figures for NY, CA, and FL.

Select the data rows and the subtotal row for NY and click on the Formulas tab.
Click on the Name Manager command inside the Defined Names commands block.
On the Name Manager dialog, click on the New button.

Customize the values of the New Name field, like Name, Scope, Comment, etc. If you need to change the selected cell range, click on the Refers to field and highlight a new cell range from the active worksheet.
Click OK to create the NY_Sales named range.
Now, repeat the same steps for the rows for CA Sales and FL Sales.

You’ll have three new named ranges in the Name Manager dialog box. Click on the Close button.

Now, click on the Name Box drop-down menu and choose one named range, like CA_Sales.

This action will select and highlight the cell range A7:D11, which corresponds to the rows reflecting the sales figures of the CA store.
So, you’ve quickly highlighted the important rows without hiding all other rows. You might not need them immediately but you also don’t want to conceal them.
An advantage of this method is that you can group and highlight rows that are non-contiguous in the selected dataset. All you need is to learn various ways to highlight every other row in Microsoft Excel.
Using a PivotTable
Suppose, you’re working on a department-wise expense dataset. There, rows aren’t organized by similar departments. If you need to group rows by values of different column headers, you can use the PivotTable tool.

For example, the above is a sample dataset. Where the items inside the Dept columns are mixed. You want to view the dataset by grouping rows in different angles, like by Unit Price, Units, or Cost.

To use the PivotTable to get data insights from grouped rows matching the department names, without manually grouping the rows, highlight the entire dataset.
Click on the Insert tab and choose PivotTable from the Tables command block.

Select the Existing Worksheet option inside the PivotTable dialog box and choose a cell on the active worksheet as the destination. Click OK to apply the configuration.

You should see the PivotTable Fields navigation panel on the right side.
Drag and drop the Dept item into the Rows field.

Let’s say, you want to get data insights based on rows grouped by the Cost header. Drag and drop the Cost item into the Values field.
You should see a tabular representation of the Sum of Costs by grouping similar rows under the Dept column.

Similarly, you can calculate the department-wise total units of items purchased, by dragging and dropping the Units item into the Values field.
Using Power Query
Power Query also allows you to create data insights by grouping rows from a dataset imported from Excel. However, it’s more useful to import a big database from an external database that an Excel worksheet can’t accommodate in the first place because of the row handling limitation of Excel.
📒 Read More: How Many Rows Can Excel Handle?

If you’re importing an external dataset to Power Query, click on the Get Data drop-down menu inside the Get & Transform Data of the Data tab.
Hover the cursor over the From Database menu and choose an option from the overflow menu, like From Oracle Database.

In the current exercise, I’m exporting a dataset to Power Query from the active Excel Worksheet. For this, I’ve selected the target dataset and clicked on the From Table/Range command in the Data tab.

Find above a glimpse of how Power Query organizes your imported dataset.

Now, go to the Transform tab and click on the Group By command.
You should now see the Group By wizard.
Here’s how to configure the Group By dialog box:
- Group By type should be Basic for one-column-based grouping and Advanced for grouping by multiple columns.
- Immediately below the Basic option, choose the column by which you’re grouping rows. For example, Dept in the current exercise.
- Enter a new name inside the New column name field.
- Choose a function in the Operation field. Let’s go ahead with Sum.
- In the Column field, choose the column header on which you want to perform the Sum function. In the present exercise, it’s the Cost column.
- Click OK to finish customizing the Group By dialog box.

Power Query will show a new dataset. It’ll have only the Group By column, which is the Dept column, and the sum of the costs of all the rows in the source dataset under the Dept Wise Cost column.

Click the File tab and choose Close & Load To.

On the Import Data dialog, click on the Existing worksheet option and select the destination cell on the active worksheet.

You’ll get a data insight into the input dataset after grouping the relevant rows and summing their cost components.
Using Excel VBA
If you want to automate the Excel group rows process, you can use VBA programming. It’s truly simple! You only need to follow a few steps to create macros. I’ll share the programming scripts to be used in those macros.
First thing first, read the following Excel tutorial to learn how to create macros from scratch:
📒 Read More: How To Use The VBA Code You Find Online
If you’re ready, use the following script to bring up the Subtotal dialog box for grouping rows in Excel:

Sub ShowSubtotalDialogBox()
    ' Declare a Range object
    Dim TargetRange As Range

    ' Show an input box and set the TargetRange to the selected range
    On Error Resume Next ' In case the user cancels the input box
    Set TargetRange = Application.InputBox("Please select the target dataset using your mouse:", Type:=8)
    On Error GoTo 0 ' Reset error handling

    ' Check if a range was selected
    If Not TargetRange Is Nothing Then
        ' Select the range
        TargetRange.Select

        ' Show the Subtotal dialog box
        Application.Dialogs(xlDialogSubtotalCreate).Show
    Else
        MsgBox "No range selected. Please try again.", vbInformation
    End If
End Sub

After creating a VBA macro using the above code, press Alt + F11 to bring up the Macro dialog.
There, click on the ShowSubtotalDialogBox macro and hit Run.

You’ll see an input box. Use the mouse to select a dataset on the active worksheet.

Click OK and Excel will show the Subtotal dialog box.
Now, follow the steps mentioned in the Subtotal section previously in this Excel tutorial to group rows.
Conclusions
So far, you’ve learned the eight best tried and tested methods to group rows in Excel.
If you’re working with a small to medium-sized dataset, you can use the Excel user interface commands, like the Auto Outline command, the Group tool, and the Subtotal command.
If you don’t want to hide a certain group of rows but only want to highlight specific rows, you can use the Name Manager tool.
To create outlines and data insights from similarly organized datasets from different worksheets, you can use the Consolidate tool.
If you’re looking to group rows and create data visualizations or extract data insights from similarly grouped rows, you can use Power Query and PivotTable-based methods.
Finally, if you wish to automate the Excel group rows process, you can use the Excel VBA-based technique.
Comment below if the article helped you to learn how to group rows in Excel. If you know a better and easier method that I might have missed, mention that in your comment.


 👉 Find out more about our Advanced Formulas course!


0 Comments