If you’re looking to save an Excel chart as an image, you’ve come to the right place. In this Excel tutorial, I’ll walk you through the best and most effective methods.
Microsoft Excel offers a rich variety of chart types – a total of 17, to be precise. These charts cover a wide range of mathematical and statistical data visualization needs. But what if you want to make these charts from your work, school, or personal data and use them on websites, social media, or any other needs?
The good news is that you can still use Excel for this purpose, and I’ll show you some clever tricks to extract charts as images. Excel provides a variety of built-in methods and programmatic functions that make this possible. Also, you can utilize your computer’s native capability to take screenshots and save the clipboard data as an image.
In this guide, I’ll present the most intuitive and effective methods to achieve this in step-by-step processes. By the end, you’ll be equipped with the knowledge and skills to create stunning image representations of your Excel charts.
Why Would You Want to Save an Excel Chart as an Image?
There are several reasons why you might want to save an Excel chart as an image. Here are some of the key motivations:
- Images are universally compatible and can be easily shared via email, social media, or documents, ensuring your audience can view the chart without needing Excel.
- Images can be directly embedded in websites and online content, making data more accessible to online audiences.
- Saving charts as images can serve as a backup in case the original Excel file becomes corrupted or lost.
- Images can be inserted into various software applications, ensuring compatibility across different platforms and devices.
- Sharing image files is the easiest of every other file. For example, smartphones and tablets come with built-in compatibility to read and display image files shared via WhatsApp, Messenger, Telegram, etc.
- Images generally have smaller file sizes than Excel files, making them easier to manage and share.
- When sharing data, you can avoid disclosing underlying data or formulas by sharing only the chart image.
- For presentations and publications, chart images can be resized and formatted for optimal visual impact.
- Images allow offline viewing of the chart, even when the Excel file is not accessible.
- Storing chart images is useful for archiving data visualization records over time.
Now that you’ve discovered various necessities to save an Excel chart as an image, find below the best methods you must learn and practice to master your Excel skills:
Use the Windows Snipping Tool to Save an Excel Chart as an Image
This is the easiest and most basic method to convert Excel charts to images. However, it’ll require a lot of effort if there are many charts that need conversion. Find below the quick steps to follow:

- Ensure the chart you want to save as an image is on the screen.
- Click the Start menu and type Snipping.
- The Windows Snipping Tool will show up as the Best match.
- Click on that.

- Click the Mode drop-down menu on the Snipping Tool toolbar and choose Rectangular Snip.
- Now, an overlay will appear allowing you to draw a rectangle around the Excel chart.

- The screenshot will then show up on the Snipping Tool interface.
- Click the Save (floppy disc icon) button on the toolbar and choose a destination.
That’s it! You’ve successfully created an image version of the Excel chart.
Save Excel Chart as an Image Using the Save as Picture Feature
You can use the Save as Picture feature for all Excel charts to save them as an image in file formats like PNG, JPEG, SVG, etc. Here are the steps you can exercise:
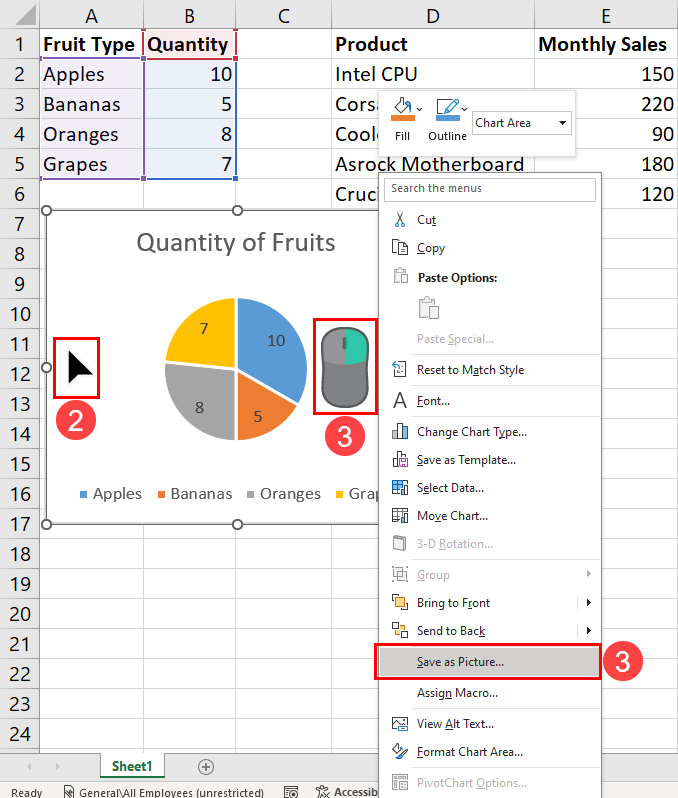
- Go to the chart you want to save as an image on your Excel worksheet.
- Select the chart by clicking on any blank space of the graph.
- Right-click and choose the Save as Picture option.

- The Save as Picture dialog box will appear.
- Choose a destination and give the image a name.
- Click OK to save the chart as an image.
To retrieve the chart pictures, simply go to the local storage directory where you saved the images.
Use Microsoft Paint to Save a Chart as a Picture in Excel
You can copy the charts of Microsoft Excel as an image in the Windows clipboard by using the right-click Copy or the Ctrl + C function. Then, you can transfer the clipboard data to any graphics design tool like Microsoft Paint and save it as an image. Here’s the procedure you can follow:

- Go to the Excel chart of interest and click on it.
- Once highlighted, press Ctrl + C on your keyboard.
- You’ve copied the chart content as an image.
- Now, open the Microsoft Paint application on your PC from the Start menu.

- Paste Ctrl + V on the blank canvas of the Paint app.
- You should now see the image of the chart you copied.
- Press Ctrl + S to bring up the Save As dialog box.

- Choose an image destination on your PC.
- Enter a name for the image file into the File name field.
- Also, pick a picture file type from the Save as type drop-down menu.
- Click Save to complete the process.
When pasting a copied Excel chart into the Paint app, you’ll get an image resize handle. If you enlarge the image using it, you may reduce the visibility of the chart. Hence, save the image as is to keep the quality intact.
Save the Excel File as HTML and Extract Charts as Images
The methods explained so far are suitable methods when you need to save a few Excel charts as images. Suppose, your Excel worksheet has more than 50 charts and you need to convert all these to their corresponding image files.
You can manually do this by saving each or follow the trick outlined below to save time and stay productive:

- Open the Excel file and navigate to the worksheet that has many charts.
- Click the File tab on the Excel worksheet and select the Save As option.
- Click Browse on the Save As screen.

- The Save As dialog box will appear.
- Choose a destination for the saved file.
- Click the Save as type drop-down menu and choose the Web Page option.
- Click Save to complete the process.
When you save an Excel file as a Web Page in HTML format, Excel creates a folder for the source files of the website. From the source file folder, you can get the charts as images. Here’s how:

- Navigate to the destination of the web page file.
- There should be a folder named the same as the web page file.
- Access the folder.
- You should now find some image files in the PNG format.
- Copy these to another directory on the internal storage.
- If there are any duplicates, delete those.
That’s it! You’ve got the image versions of your Excel charts in a few clicks.
Use Paste Special to Save Excel Chart as an Image
Suppose, you need to export an Excel chart to Microsoft Word. You can copy the chart from the source and paste it into your Word document. However, that’ll export a functional Excel chart, just as you see it in your Excel workbook.
However, you might want to export the chart as an image to disable functions offered by a functional Excel chart. Here, you can use the Paste Special option. Here are the steps to follow.

- Go to your Excel worksheet and select the chart you want to export as an image.
- Press Ctrl + C after highlighting it.

- Now, go to the Microsoft Word document.
- Press Ctrl + Alt + V to bring up the Paste Special dialog.
- Choose an image format from the dialog box you see.
- Click OK to save the chart as an image in your Word document.
This method shall also work on most other Microsoft apps like PowerPoint, Publisher, Visio, etc.
Save Excel Chart as an Image Using Excel VBA
Excel VBA (Visual Basic for Applications) provides a powerful way to automate tasks within Excel, and saving Excel charts as images is no exception.
Whether you need to create a series of chart images for a report, presentation, or any other purpose, VBA can streamline the process.
This method is particularly useful when you have multiple charts within an Excel workbook and want to save them as images in a specific format. Here are the steps you can follow:

- Go to the Excel VBA Editor. You can do so by pressing Alt + F11 keys on the keyboard.
- Now, click the Insert button on the Excel VBA toolbar.
- Click on the Module option now.
- Then, copy and paste the following script into the new module:
Sub ExportChartsAsPNG()
    Dim ws As Worksheet
    Dim cht As ChartObject
    Dim chartPath As String
    Dim chartIndex As Integer

    ' Set the worksheet where the charts are located
    Set ws = ThisWorkbook.Sheets("Sheet1")

    ' Specify the path for the "Charts" folder on the D drive
    chartPath = "D:\Charts\"

    ' Create the "Charts" folder if it doesn't exist
    If Dir(chartPath, vbDirectory) = "" Then
        MkDir chartPath
    End If

    chartIndex = 1

    ' Loop through each chart in the worksheet
    For Each cht In ws.ChartObjects
        ' Export the chart as a PNG image
        cht.Chart.Export Filename:=chartPath & "Chart" & chartIndex & ".png", Filtername:="PNG"
        chartIndex = chartIndex + 1
    Next cht

    ' Display a message when the export is complete
    MsgBox "All charts have been exported as PNG images to the 'Charts' folder on the D drive."

End Sub
- Click the Save icon on the toolbar.
- A warning dialog will pop up.
- There, click on the No option and choose XLSM file format in the Save as type drop-down of the Save As dialog box.
- Now, close the Excel VBA Editor tool.
Here are the instructions to modify the above script:
- In the
ThisWorkbook.Sheets("Sheet1")code element, replaceSheet1with the worksheet name of your workbook. - Change the directory address where Excel should save the images in code element
chartPath = "D:\Charts\"by replacingD:\Charts\with another path address. - Change the .png image file extension to another one like .jpg, if needed, in the
".png"code element.
Here’s how you can execute the above VBA macro:

- Press Alt + F8 to bring up the Macro dialog.
- Choose the ExportChartsAsPNG macro.
- Click Run to execute it.
Excel will export all the charts of the selected worksheet to the designated directory on your computer.
Conclusions
Now you know all the effortless ways to export Excel charts as images. If you do this occassionally and for a few charts in your Excel worksheet, use the methods involving the Snipping Tool, Saves as Picture on Excel chart right-click menu, copy chart to clipboard and save as image in Microsoft Paint, and the Paste Special command.
When you need to extract all the charts as images in a folder automatically, you can save the Excel workbook as a HTML or Web Page file.
Finally, if you know how to code in Excel VBA or okay with experiementing with VBA scripting in Excel, try out the Excel VBA-based method.
Were you able to save your Excel charts as images using any of the above methods? Tell your experience by writing a comment below. You can also sharee your feedback or send me an idea for the next Excel tutorial article.


 👉 Find out more about our Advanced Formulas course!


0 Comments