How To Enable Status Bar Summary Statistics

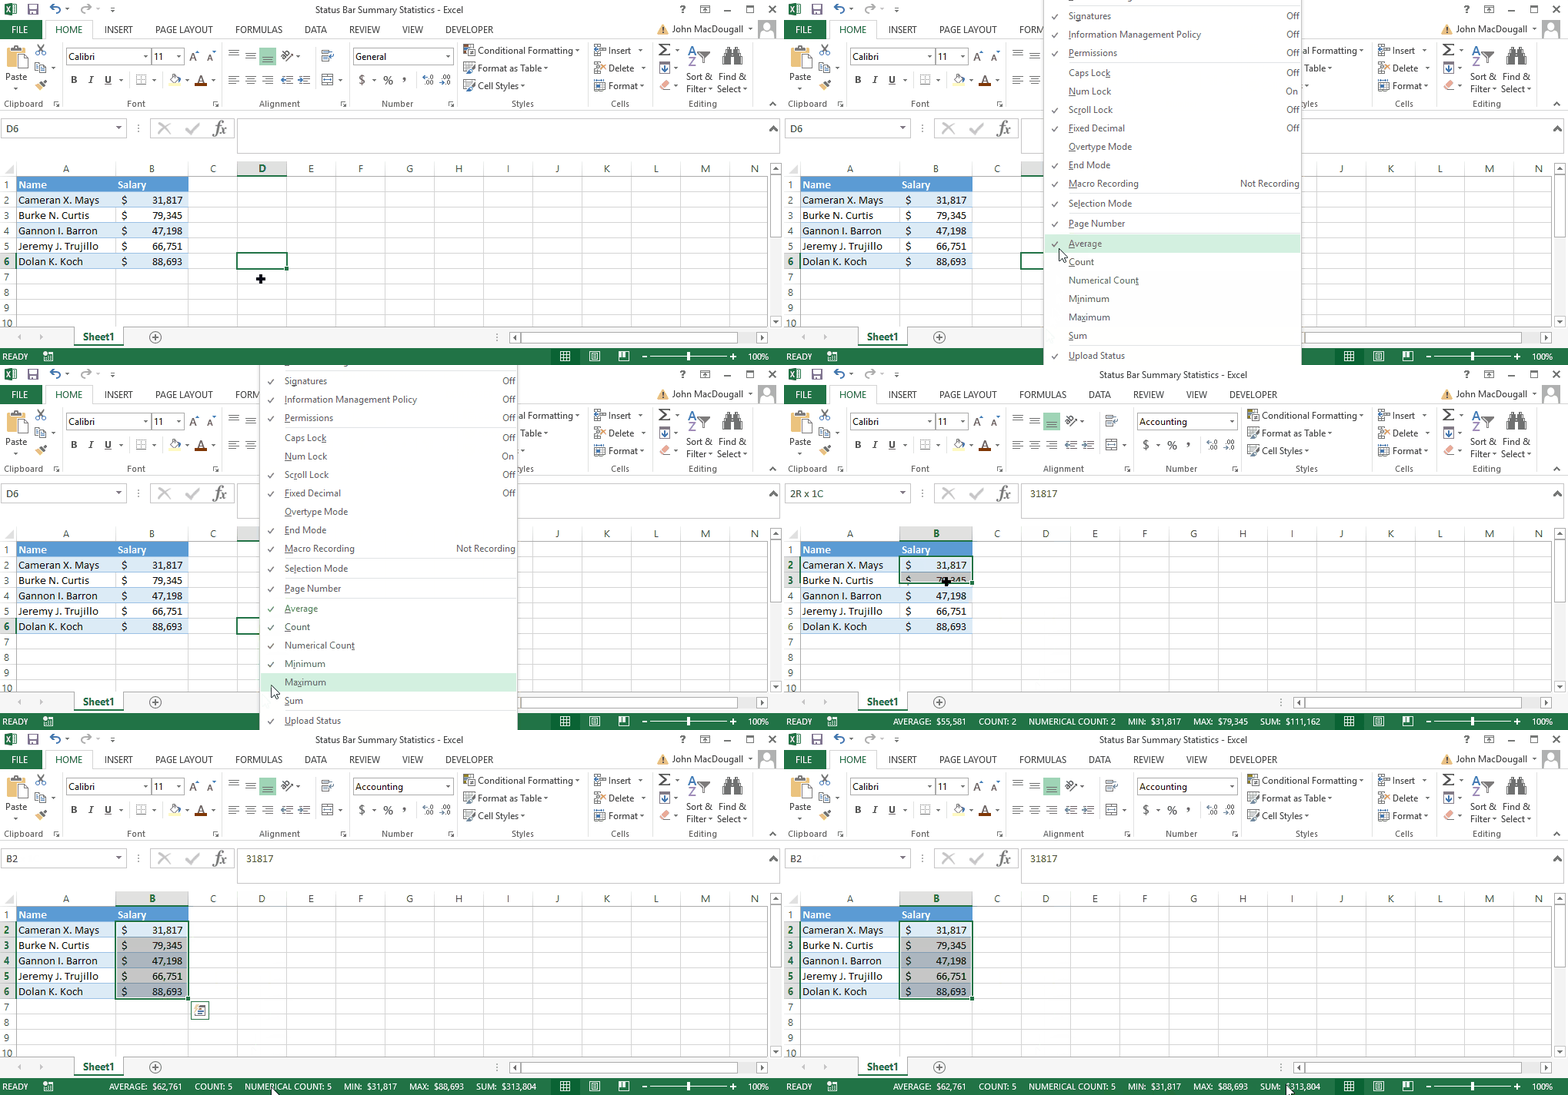
Here’s a neat trick that will allow you to see “at-a-glance” summary statistics for any range you highlight in Excel. With this you’ll be able to see a calculated average, count, minimum, maximum and sum for any range with numerical values.


step-001-how-to-enable-status-bar-summary-statistics


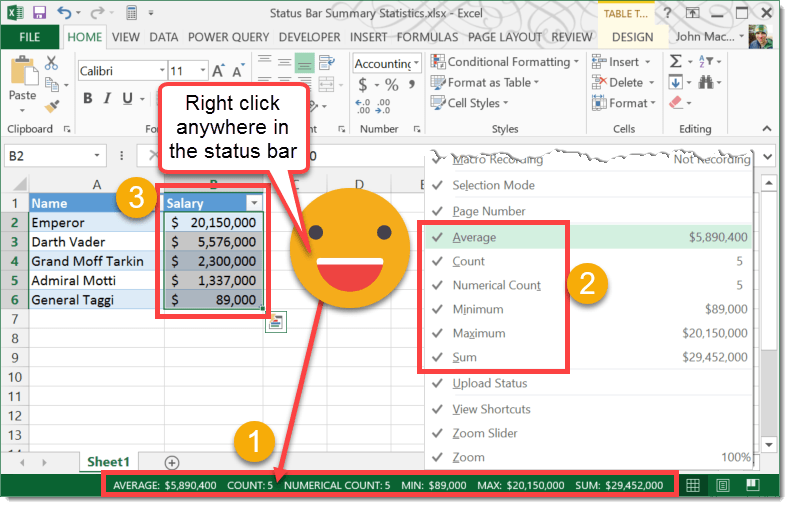
Enable the summary statistics.

  1. Right click on the status bar.
  2. Select the items you would like to see.
  3. Highlight a range of numbers and the summary statistics for that range will appear in the status bar.


Wow, the average salary for the Galactic Empire is $5,890,400, sign me up!
 

Status Bar Summary Statistics

About the Author

John MacDougall

John MacDougall

John is a Microsoft MVP and qualified actuary with over 15 years of experience. He has worked in a variety of industries, including insurance, ad tech, and most recently Power Platform consulting. He is a keen problem solver and has a passion for using technology to make businesses more efficient.

Related Posts

37 Awesome Excel Mouse Tips & Tricks You Should Know

37 Awesome Excel Mouse Tips & Tricks You Should Know

While the keyboard is generally quicker, you shouldn’t completely ignore the mouse. There are also some great time saving mouse shortcuts as well. In this post we’ll take a look at some of the best Excel mouse time saving tips and tricks.

read more
25 Amazing Power Query Tips and Tricks

25 Amazing Power Query Tips and Tricks

Power query is amazing tool that allows you to import and transform data with ease and helps to create repeatable and robust procedures with your data. Here are some tips and tricks to help you get the most out Power Query.

read more

Comments

0 Comments

Get the Latest Microsoft Excel Tips

Follow Us

Follow us to stay up to date with the latest in Microsoft Excel!

Subscribe for awesome Microsoft Excel videos 😃